
Page 10 - CODIC 2016/2017 - Annual report
P. 10
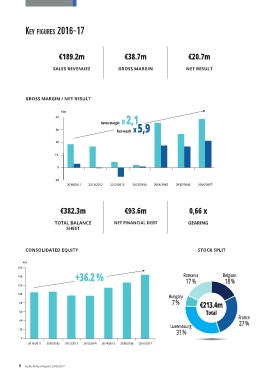
Key fiGureS 2016-17
€189.2m €38.7m €20.7m
SALES REVENUES GROSS MARGIN NET RESULT
€m
GROSS MARGIN / NET RESULT 160
140 +36.2 %
€m
40 Gross margin x 2,1 120
Net result x 5,9 100
30
80
20
60
10 40
20
0
0
- 10 2010/2011 2011/2012 2012/2013 2013/2014 2014/2015 2015/2016 2016/2017
2010/2011 2011/2012 2012/2013 2013/2014 2014/2015 2015/2016 2016/2017
€m
160
€382.3m Romania €93.6m Belgium 0,66 x 140 +36.2 %
17 % 18 % Gross margin x 2,1 120 16,7 %
€m
40
GEARING
TOTAL BALANCE NET FINANCIAL DEBT 30 Net result x 5,9 100
SHEET 80
20 60
Hungary 10 40
7 %
Unsecured
20
CONSOLIDATED EQUITY €213.4m 0 STOCK SPLIT €173.6m Secured
0
Total - 10 2010/2011 2011/2012 2012/2013 2013/2014 40 % 2016/2017 Total 2011/2012 2012/2013 60 % 2014/2015 2015/2016 2016/2017
2013/2014
2010/2011
2015/2016
2014/2015
€m
160 France
Romania
140 +36.2 % 27 % Belgium
€m Luxembourg 17 % 18 % 16,7 %
40 Gross margin x 2,1 120
Net result x 5,9 100 31 % 83,3 %
30 Hungary
80 7 % €213.4m Unsecured €173.6m Secured
20 40 % 60 %
60 Total Total
10 40 France
27 %
Luxembourg
20
0 31 % 83,3 %
0
- 10 2010/2011 2011/2012 2012/2013 2013/2014 2014/2015 2015/2016 2016/2017
2010/2011 2011/2012 2012/2013 2013/2014 2014/2015 2015/2016 2016/2017
Romania Belgium 8 Codic Annual Report 2016/2017
17 % 18 % 16,7 %
Hungary
7 % €213.4m Unsecured €173.6m Secured
Total 40 % Total 60 %
France
Luxembourg 27 %
31 % 83,3 %