
Page 10 - CODIC 2017/2018 Rapport annuel
P. 10
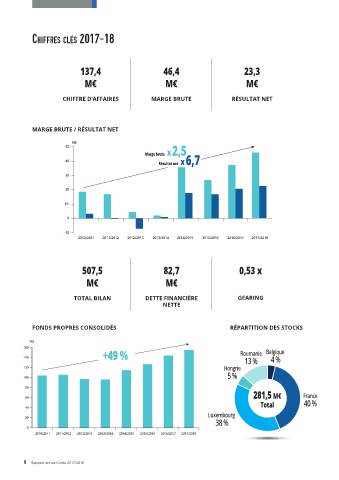
ChiffreS CléS 2017-18


                             137,4                        46,4                         23,3

                               M€                          M€                          M€


                       CHIFFRE D’AFFAIRES             MARGE BRUTE                 RÉSULTAT NET


            MARGE BRUTE / RÉSULTAT NET                                                                                     M€
                                                                                                                        160
                          M€
                        50                          Marge brute   x 2,5                                                 140                            +49 %
                                                                                 Résultat net   x 6,7
                        40                                                                                              120
                                                                                                                         100
                        30
                                                                                                                         80
                        20
                                                                                                                         60
                        10                                                                                                 40

                                                                                                                           20
                         0
                                                                                                                          0
                       - 10                                                                                                  2010/2011  2011/2012  2012/2013  2013/2014  2014/2015  2015/2016  2016/2017  2017/2018
                            2010/2011  2011/2012  2012/2013  2013/2014  2014/2015  2015/2016  2016/2017  2017/2018

                                         Roumanie     Belgique                                                                                    M€

                              507,5         13 %        4 %              50  M€      0,53 x  Marge brute   x 2,5                                160         16,7 %     +49 %
                                                          82,7
                                  Hongrie
                                                                                                                                                140
                               M€                          M€            40                                                 Résultat net   x 6,7  120
                                   5 %
                                                                         30                                                                      100
                           TOTAL BILAN              DETTE FINANCIÈRE                 GEARING                                                    80
                                                          NETTE          20                                                                     60
                                                281,5 M€               France              Unsecured            173,6 M€               Secured     40
                                                                        10
                                                                                             40 %
                                                                                                                                        60 %
                                                                         0
            FONDS PROPRES CONSOLIDÉS               Total                40 %      RÉPARTITION DES STOCKS           Total                           20 0
                          Luxembourg                                    - 10  2010/2011  2011/2012  2012/2013  2013/2014  2014/2015  2015/2016  2016/2017  2017/2018  2010/2011  2011/2012  2012/2013  2013/2014  2014/2015  2015/2016  2016/2017  2017/2018
           M€
         160                  38 %
 M€                                  +49 %                                           Roumanie  Belgique
 50  Marge brute   x 2,5  140                                                          13 %     4 %                                                                                83,3 %
                                   Résultat net   x 6,7                                                                                                                   16,7 %
 40      120                                                                    Hongrie
          100                                                                    5 %
 30
          80
 20                                                                                       281,5 M€          France        Unsecured       173,6 M€         Secured
          60                                                                                                                40 %                            60 %
                                                                                             Total          40 %                            Total
 10         40
                                                                          Luxembourg
            20
 0                                                                           38 %
          0                                                                                                                                                                                 83,3 %
 - 10        2010/2011  2011/2012  2012/2013  2013/2014  2014/2015  2015/2016  2016/2017  2017/2018
 2010/2011  2011/2012  2012/2013  2013/2014  2014/2015  2015/2016  2016/2017  2017/2018

 Roumanie  Belgique
 13 %  4 %  8      Rapport Annuel Codic 2017/2018   16,7 %

 Hongrie
 5 %


 281,5 M€  France  Unsecured  173,6 M€  Secured
 Total  40 %  40 %  Total  60 %

 Luxembourg
 38 %
                                                               83,3 %